ONE HUNDRED HOMES
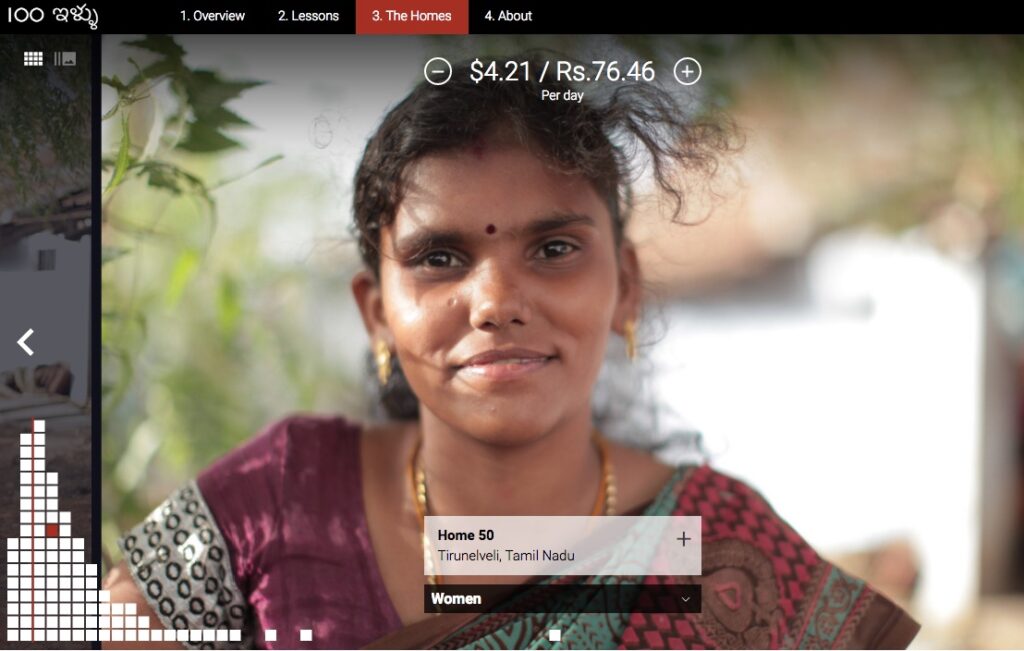
For One Hundred Homes, I shot in 360 VR, still imagery and film for journalist and director Evan Wexler, commissioned by Jeff Hammer, an economist with 30 years of on-ground experience in public health in India. The project mapped the living and working spaces, room by room, of one hundred families across rural India in 2018, a visual survey of the inequalities across the Poverty Line.
With increasing interest in economic inequality around the world and, especially, in this long period of economic growth in India, there is always a risk of losing sight of what ordinary peoples’ lives are like that underpin the abstractions of “inequality” and “poverty”. Since actual policy is often guided by such abstractions, the purpose of this project is to tether the very concretely-defined statistics to the way the lived lives underlying them actually look. The hope is that people will come to approach public discussions of income inequality and poverty with a grounded sense of the reality behind the numbers. And perhaps more skepticism.

One Hundred Homes illustrates with pictures, videos, 360 images, and family descriptions what people inside the statistics of income or consumption interviewed for standard government surveys look like in real life. It organizes the one hundred visual essays according to the results of a household consumption survey used throughout India, and the world for that matter, that are used by researchers, statisticians and policy makers to bring out the richness of life under the numbers. One Hundred Homes is the result of a collaboration between journalists, economists, sociologists, photograpers, videographers, survey researchers and others as follows:
Videographer: Milann Tress John
Photographer: Andrew Ash
Narrator: Avantee Aneeta
Field Translator: Pooja Bohra
Videographer: Alice Cafrae
Sociologist: Ravella Beena Chowdary
Initial Development: Carolyn Edelstein
Website Producer: Heather Grieve
Produced By: Jeffrey Hammer
Statistician: Brijlal Joshi
Survey Researcher: Jitendra Kumar
Sociologist: Amrita Lamba
Editor: Mannika Mishra
Sociologist: Nithya Nagarathinam
Sociologist: Sanjana Patro
Field Translator: Dinesh Pandey
Survey Researcher: Mangla Prasad
Sociologist: Jith J R
Sociologist: Dibakar Das Roy
Field Translator: Chameli Roy
Developer: Jen Saxena
Sociologist: Katyayni Seth
Journalist: Shreya Shah
Sociologist: Sarayu Srinivasan
Sociologist: Lovey Pant
Sociologist: Nikhil Srivastav
Project Development: Rachel Steinberg
Lead Developer: Dan Sundy
Journalist: Divya Trivedi
Field Translator: Jyoti Tripathi
Field Translator: Manisha Vyas
Survey Researcher: Premlata Verma
Animator: Justin Wotherspoon
Directed By: Evan Wexler
Supporting Logistics: Zara Wexler
Editor: Adam Wiseman
Designer: Alex Wittholtz
Sociologist: Chaitra Yadavar
Field Producer/Photographer: Rajan Zaveri
NOTES ON METHODOLOGY
Large scale surveys tell us precisely what the overall distribution of income (or consumption) is. The project matches individual homes to their rightful “slots” in the income distribution to show what people at different levels of income look like. We did not do any research of our own to determine what the distribution of consumption is in India. We took this information from standard sources.
The survey that was used to define that distribution was the India Human Development Survey (IHDS) of 2012 administered by the National Council of Applied Economic Research in Delhi. The questionnaire used in that survey is exactly the same as the one used by the National Sample Survey (NSS) done by the government every year or two. The IHDS survey consists of over 42000 households nationwide. This is about the same number as the NSS “thin” round (every five years they do a larger “thick” round of about 120,000). The surveys give virtually identical results. The One Hundred Homes project took this distribution as given – one hundred is a tiny number in comparison. There was no attempt to independently estimate the distribution or to do any statistical inference from the data at all.
Since one hundred is such a small number, we formed a histogram using one hundred boxes to fit inside the “true” distribution from the larger surveys. Each of these boxes told us how many people we needed to find at each level of income. The intervals – the width of the histogram – were chosen to show the overall shape reasonably accurately.
How did we find the homes? Being too difficult to find one hundred individual households across the country, we decided to use twenty places and choose five homes from each. The twenty places were roughly in proportion to the Indian population. There are six urban and fourteen rural locations. One billion two hundred thousand divided by twenty is sixty million. Based on the census, anyplace that had anything like sixty million people was assigned one location (rural Maharashtra and rural West Bengal were the closest matches). With some leeway (all of the rural south warranted three locations among four states; we slightly shortchanged some places like rural Uttar Pradesh and Bihar to accommodate some smaller but important areas like Delhi, Mumbai, the Northeast (always overlooked) and Himachal Pradesh (this is a VISUAL survey so the artists among us insisted) even though they do not each have 60 million residents).
Explore One Hundred Homes here : https://onehundredhomes.in/


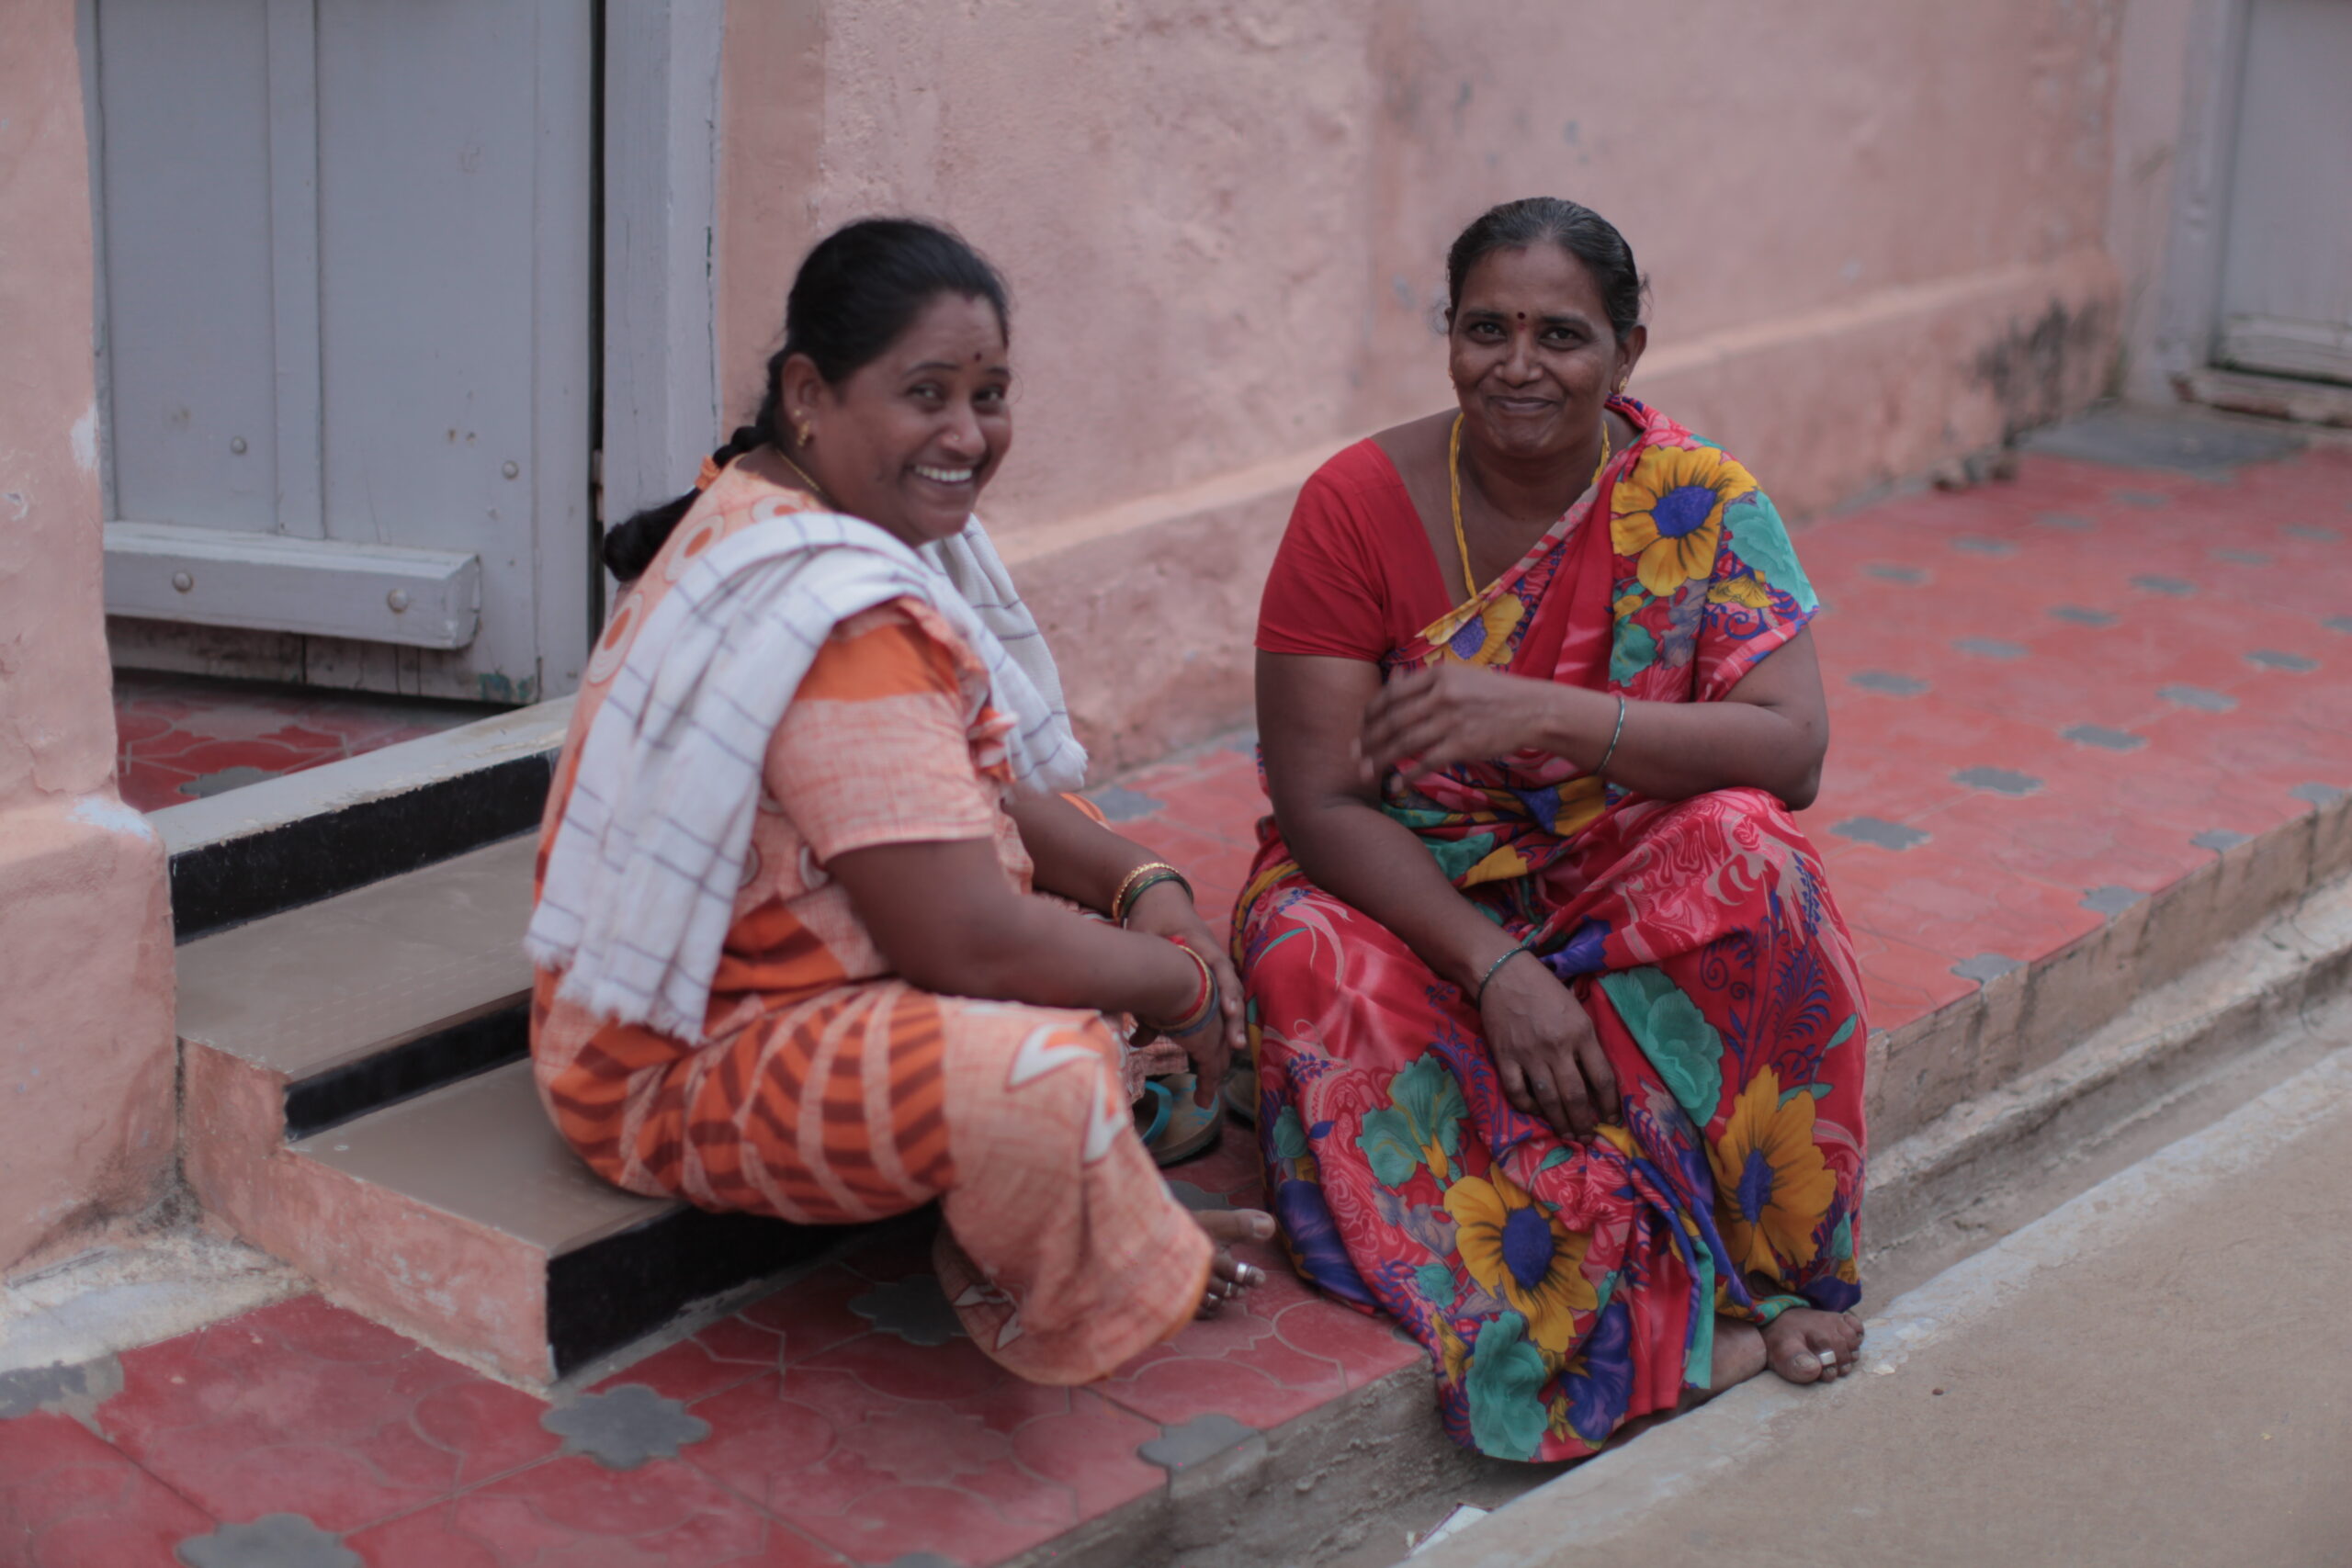
A Photo Story from Tamil Nadu
From when we went visiting a small village where women worked by hand to break ‘fast fashion apparel’ down to fibre for repurposing. These ladies took us past their homes and street courtyards to the school where their children were at. Here’s to women on both ends of the scale of instant consumption, everyday.